In October of 2017, a few collegues and I walked down West Creek, in Parma, Ohio to do some prospective mapping of the stream corridor. The hope was this: that by taking a sequence of photos from within the stream, we could use photogrammetry to reconstruct the corridor and ultimately model water flow through the same corridor.

Knowing the the reconstruction of this complex physical space might be challenging, we not only walked down and back up the stream, but took 6-10 photos at each station (a few pace walk) in order to capture all the features of the stream. This is similar in some ways to what a flight planner does in mapping mode on a drone, only a lot more manual.
The prospective becomes restrictive
It turned out, that from a processing perspective, we were in over our heads. 1396 photos in technical debt, we never processed the dataset, until now. We didn’t have the compute power nor effective enough algorithms, let alone the 10s to 100s of hours to just let a machine process.

When I see results like this, I get excited, but such datasets have to prove to be useful. Exactly how well do these data, collected right down in the stream, serve as synoptic data? How succinctly, completely, and effectively do they show us the shape of the stream? Is this just a cool looking trick?
From specific to synoptic

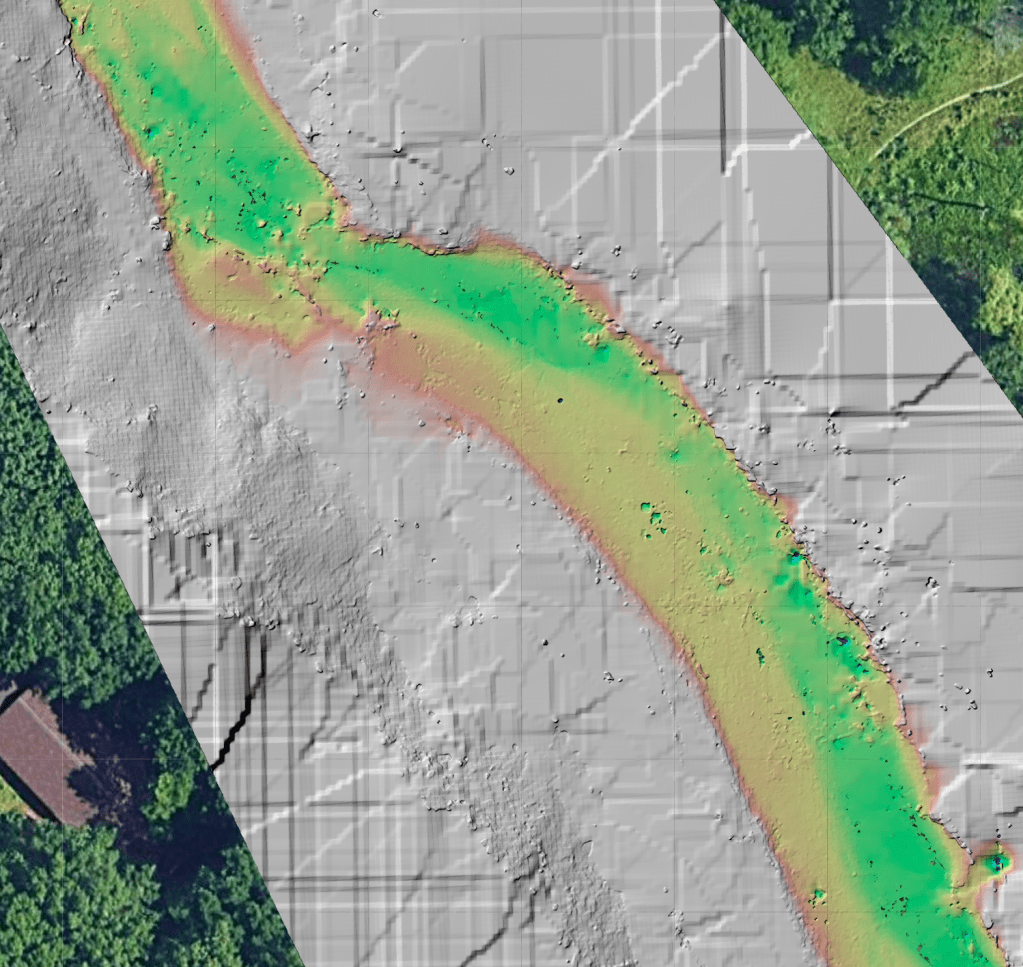
While we will need to see how these data perform in a hydrologic model, a cursory review of the synoptic data is quite promising. Here’s the surface model near the partially blocked section of stream pictured above.

And here we see a digital terrain model derived from the same dataset showing the basic shape of the stream bottom, including the rocky shoals shown in the photos in yellow above the deeper, currently flowing portion of the stream in green.
Finally, we take a look at the full 400 meters of creek that we mapped.

The stats
We already know that this is the result of almost 1400 images taken in the stream, not from above. This is promising: it’s not always practical to get drone imagery above, depending on regulations, tree cover, project needs, and more. But 1400 images is a lot. How long did it take to process and on what kind of hardware?
Memory
free -ht
              total        used        free      shared  buff/cache   available
Mem:            62G        501M         60G        1.1M        2.0G         61G
Swap:          8.0G          0B        8.0G
Total:          70G        501M         68G
CPUs
processor cores : 8
model name      : Intel(R) Xeon(R) CPU E5-2670 v2 @ 2.50GHz
Time
How long did it process for? This is a harder stat, because it is shared hardware, but with the above specs and largely getting those CPU resources dedicated, this ran for 66 hours, 23 minutes.

Love your work. I do somewhat similar work in the utility industry but find your’s much more fascinating. Keep it up.
Thanks Randy!
This is great.
My results from tests with ODM and hand held cameras have varied. It’s usually very “noisy”.
(https://geosupportsystem.se/2018/12/27/promenad-med-webodm/, https://geosupportsystem.se/2019/09/04/ingen-dronare-inget-problem/, etc)
However, by elevating the camera just a few meters and pointing it slightly down (long selfie stick), noise is reduced significantly.
For tight spaces I’ve also started to experiment with 360 degree spherical cameras. This has potential, but I haven’t access to a 360 camera with GPS, which would improve the results, I think.
Compared to commercial software like Metashape Pro, ODM is not really close in comparison, yet. But it is really impressive what is possible with open source.
Awesome. Thanks for the links Klas. Really interesting write-ups and uses of WebODM I haven’t directly read about.
A couple of thoughts on improving results: turn off linear in your gopro. Automated fisheye corrections are an anathema to photogrammetry, and create unsolvable problems. Instead, allow for the fisheye, and then use that camera type in your reconstruction.
For non-fisheye lense, try the Brown-Conrady or “brown” model. I think you’ll find the results are approaching indistinguishable from closed-source products. This feature has only recently been added.