Stamen has a great blog entry on mapping for parks on their blog. It’s a teaser for a deeper dive in mapping parks, and I’m staying tuned, as their write-ups tend to be detailed, thoughtful, and complete.
I thought I’d offer my own teaser– a bit of work done collaboratively with GreenInfo Network. It started with their basemap– something they spent a few person-years refining from OSM data.
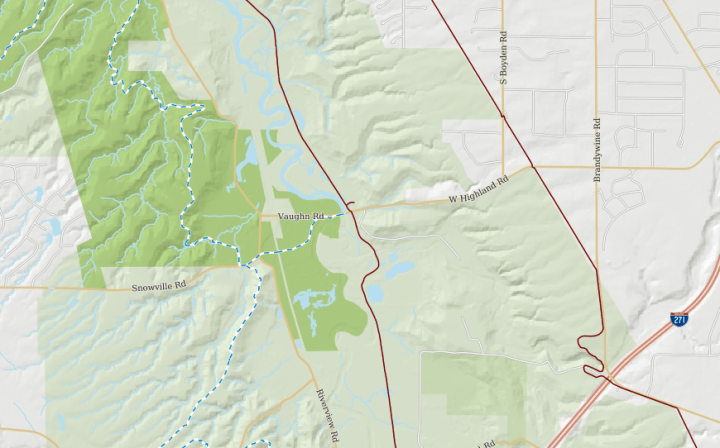
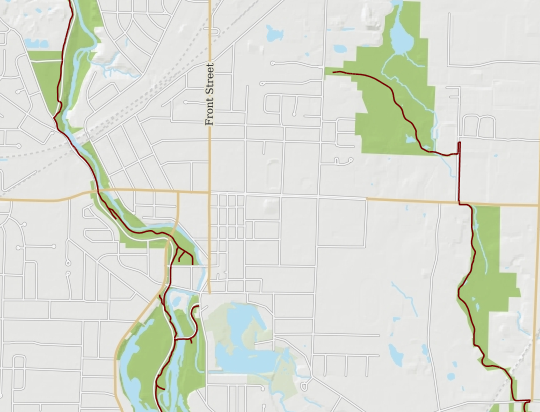
We took it a little further by creating custom placed labels where the labels gave us some extra bang for the buck.
And then we started to really play with the zoomed in versions, using nicely detailed streams, contours, and canopy boundaries (derived from LiDAR) to enrich the map, labeling natural features and major facilities with custom labels as well:
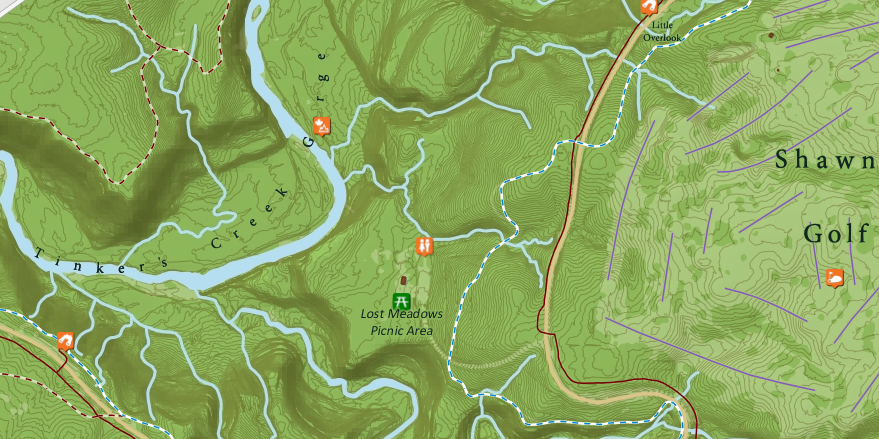
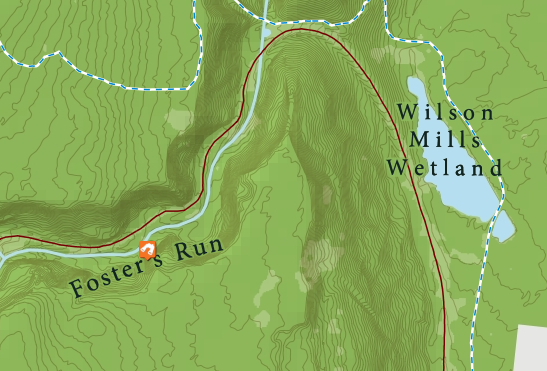
A couple of tricks we used here– first, the custom labels have shadows (convex hull) masks which match the background, ala this write up:

Also, compositing is used heavily– the hillshade background is flattened significantly, and then overlayed with multiplied composites of park green, canopy green on top, contours, with all other layers being simple overlays. This results in a brightness and clarity to the information that allows for complexity without either muddling the map, or overwhelming the map reader.
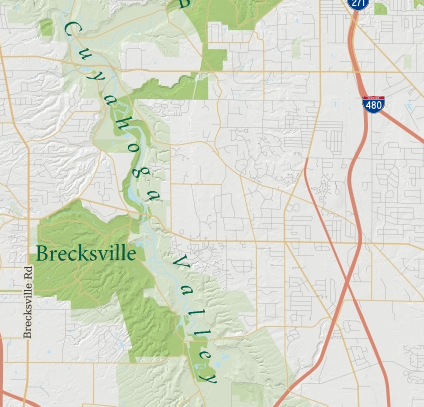
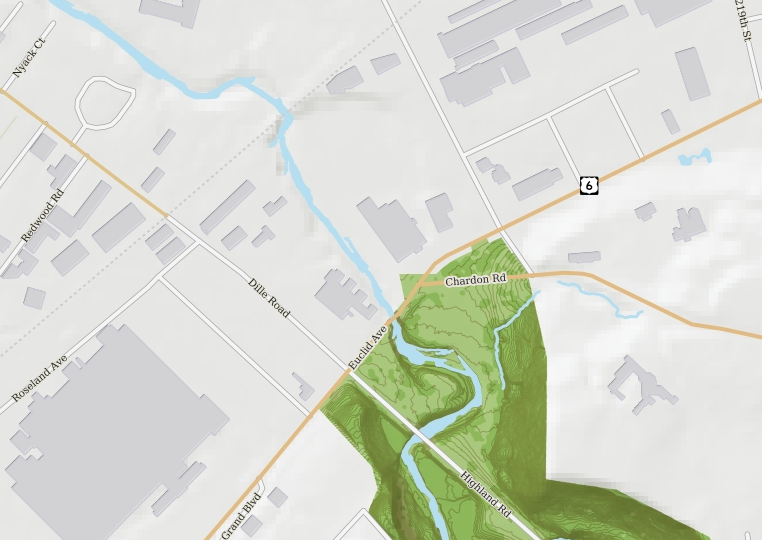
Finally, since many of the parks are urban, major buildings are highlighted for context. In future revisions, we’ll add more (but still subdued) detail to the areas outside the parks, but this was a good start:
In case you are wondering about technology, this is all done in TileStache (edit: and GeoServer). In the future, this may well be replicated in Tilemill. More to come… .

Stephen, does the parks data in this post come from GreenInfoNetwork? I worked with their data a few years ago for some park access mapping.
Now I’m leaning towards OSM for park data… how have you found the availability of park data in OSM compared to Green Info Network, etc…
We used our own regional inventory, so I haven’t done any comparisons.