A classic and age old problem in GPS is collecting potentially wonderful data in the field, getting back the office, and realizing a lot of manual scrubbing, data massaging, and other such careful work will need to be done to make the GPS data useful and meaningful. This assumes we can even meaningfully correct it at all.
This is true too (maybe especially) for GPS enabled cameras in canyons and urban canyons. This is a problem we started to explore in https://smathermather.wordpress.com/2014/08/31/foss4g-korea-2014-poor-gps-photos-and-mapillary/
Let’s return to the problem briefly. Were the GPS readings to be consistent and accurate, we should see a relatively straight line of points as the photos were taken along the length of sidewalk on Teheran-Ro in the Gangnam District of Seoul

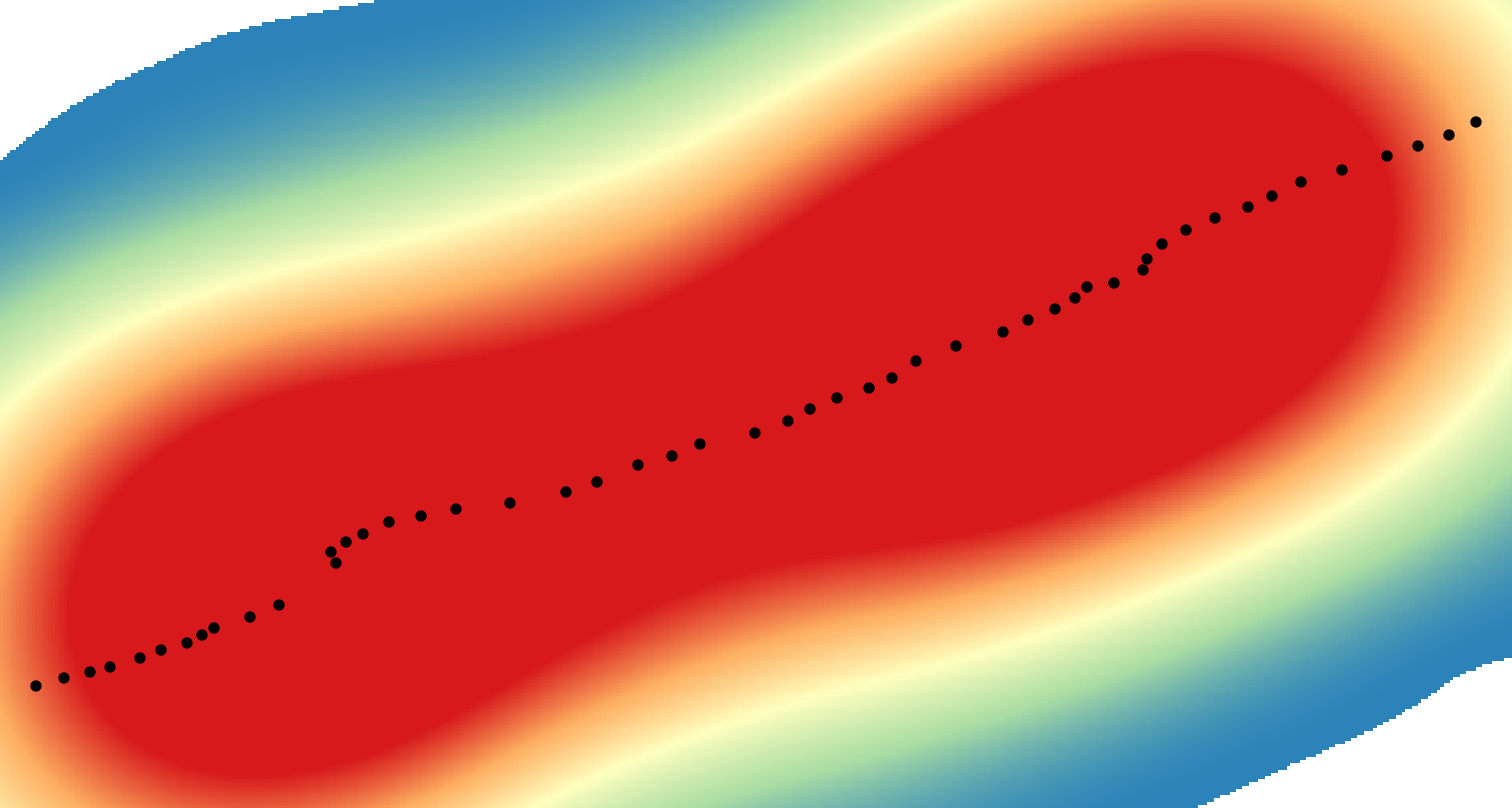
In addition to not looking straight, though it is supposed to follow a road, we previously demonstrated that there are a lot of points duplicated where, presumably, the camera was using cached GPS data rather than the latest available at the time of the photo. We can see this density of overlapping points even more clearly using the heatmap tool in QGIS:

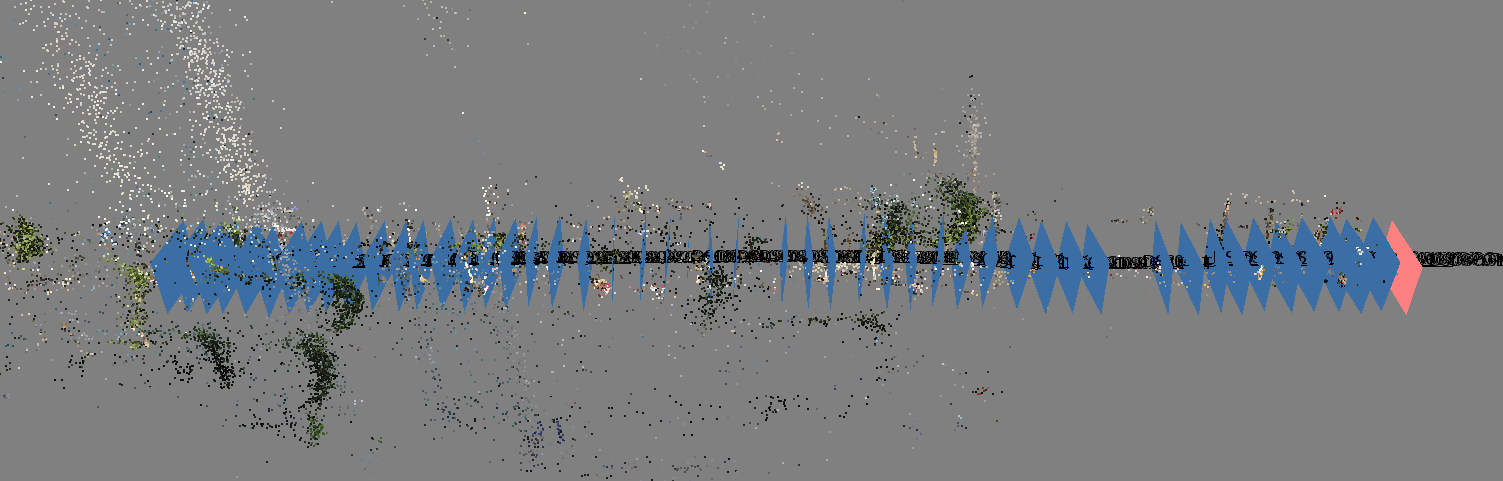
The clump of red shows a clear issue of overlapping points. As these points are the GPS positions of photographs, we can match features between photographs (using structure from motion) to map out the relative location of these photos to each other. The points in the below figure show the matched points in 3 or more photos, the blue shapes represent camera positions within the scene.
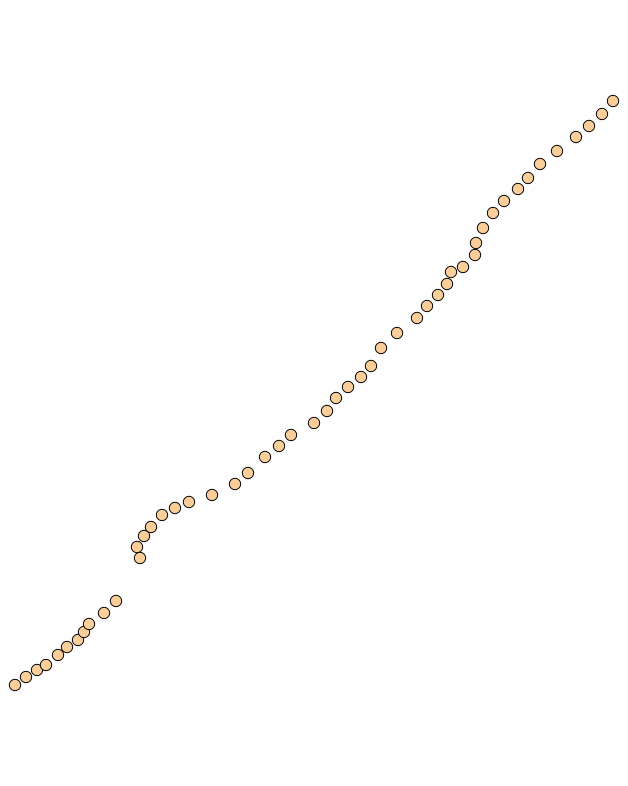
If we look at just the camera locations on a map, we see something like the following:
For the astute student however, it should not be surprising that the coordinates of these points are not recognizable as any known coordinate system. For example let’s view the X, Y, and Z of the first three points:
id	X	Y	Z
1	-0.357585	-0.390081	-3.48026
2	-0.326079	-0.367529	-3.24815
3	-0.295885	-0.348935	-2.98469
4	-0.272306	-0.334949	-2.79409
This means we require some equation to convert between our unreferenced (but consistent) data to a known coordinate system. To build this equation, we just need to know four things about our data with some certainty — the start point and end point X and Y positions. We will ignore Z for this exercise.
Point 1:
X-Local: -0.357585
X-KUCS: 958632.326047712
Y-Local: 1.29161
Y-KUCS: 958744.221397964
If we remember our trigonometry (or google our trigonometry…) then we’ll be able to solve for our X and Y values independently. For example for X:
X1 = 67.8485 * X + 958657
With that and our Y equation:
Y1 = 27.2400 * Y + 19444469
Now we can transform our local coordinates into the Korean 2000 Unified Coordinate system, and get a much nicer result:

If we perform a heat map on this output, we’ll see that we have spread out our duplicate geometries to their correct, non-overlapping spacing:
Whew! Now to write some code which does this for us… .
Oh, wait! We forgot the final test. How do they look together (pre and post transformed — post transformed as stars of course):

But, as we know Google (or in the case of Korea, Naver) is the all knowing authority on where thing are. How does this bear out against satellite imagery?:
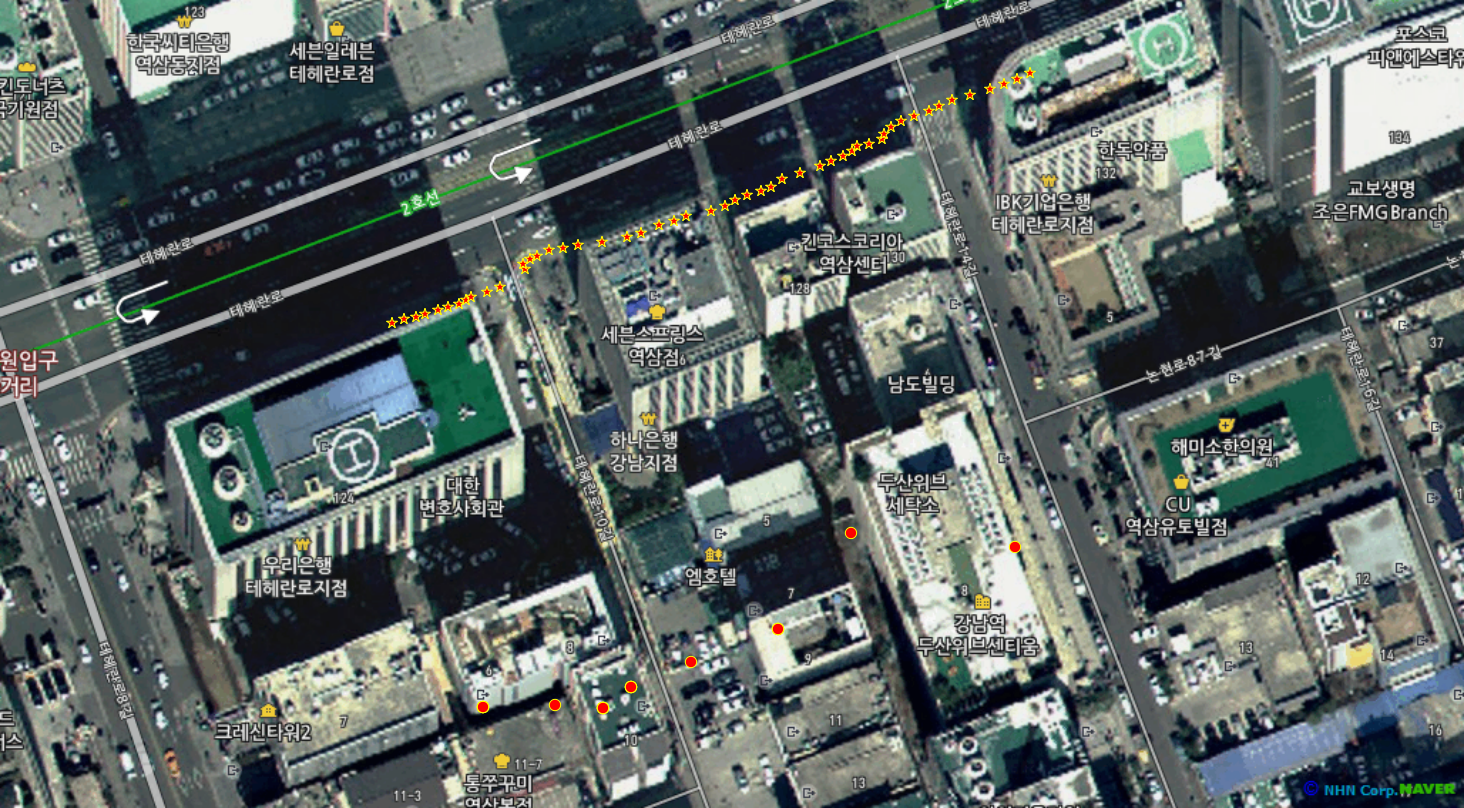
Woah! That works for me. Notice, we can even see where I walked a bit to the left side at intersections to move around people and trees.
