Ok, with a little help from Bradley Chambers on the PDAL mailing list, we are back in business. If we want to filter our newly calculated heights into a new PDAL output, we can do that easily, say all points 100-500 above ground level:
pdal translate 54001640PAN_heightasz.bpf 54001640PAN_heightasz_gt100.bpf -f range --filters.range.limits="Height[100:500]"
A little sanity check to see if we are getting appropriate values:
pdal info --stats 54001640PAN_heightasz_gt100.bpf --dimensions "Height"
{
  "filename": "54001640PAN_heightasz_gt100.bpf",
  "pdal_version": "1.1.0 (git-version: 64c722)",
  "stats":
  {
    "statistic":
    [
      {
        "average": 105.8738232,
        "count": 179909,
        "maximum": 194.5800018,
        "minimum": 100,
        "name": "Height",
        "position": 0
      }
    ]
  }
}
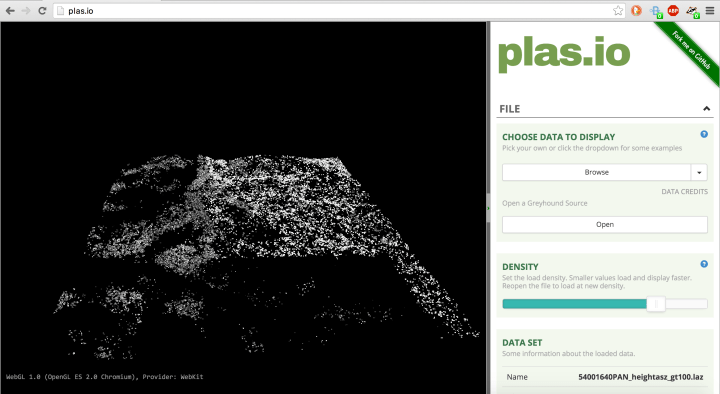
Ok, now I want to view this. I could convert to a *.laz file and view it with plas.io (as long as I use Chrome as my browser).
I have to switch back to docker, ’cause that’s where I have PDAL built with laszip:
docker run -v /home/gisuser/test:/data pdal/master pdal translate //data/54001640PAN_heightasz_gt100.bpf //data/54001640PAN_heightasz_gt100.laz
And now I can view in plas.io: