
Š-L-M
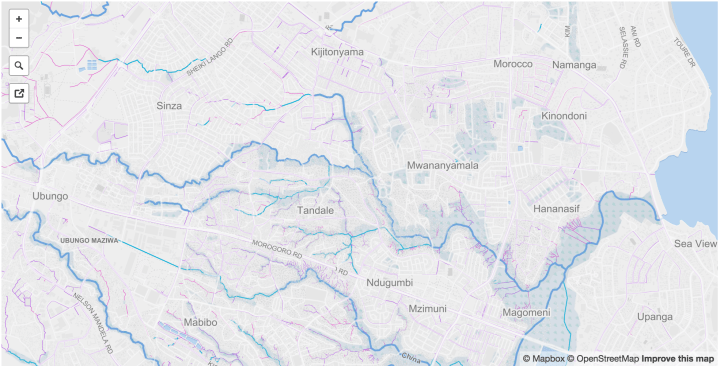
Lately I’ve been helping with project to predict flooding in Dar es Salaam (“Home of Peace”), the capital former capital of Tanzania in East Africa. This is a really fun project for me, in part because most of the hard work is already done, but there still remain some tricky problems to solve.
This project is a part of Dar Ramani Huria, a “community-based mapping project… training university students and local community members to create highly accurate maps of the most flood-prone areas of the city using OpenStreetMap.”
Dar es Salaam (or Dar for short), is the fastest growing city in Africa, making the identification of flood prone zones during rainy seasons absolutely critical. The Ramani Huria crew has mapped the streams, ditches, and other waterways of Dar, as well as flown imagery (via drone) over much of the city critical parts of the city.
Problem Space:
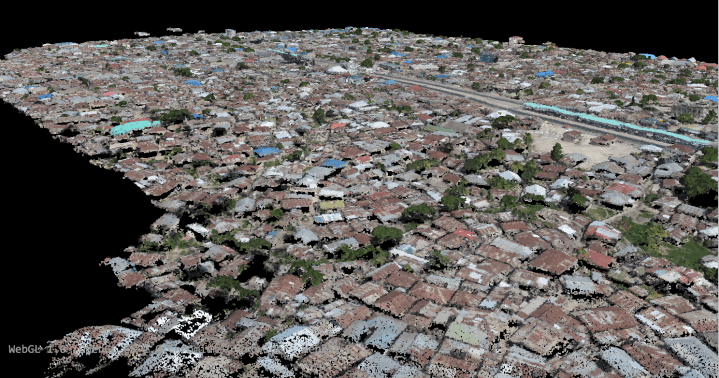
The results are stunning, but using drone imagery and photogrammetric point clouds (instead of LiDAR) has it’s limitations.
One problem, that I’m not going to get into in any depth today, is the difficulty of conflating (vertically and horizontally) different datasets flown at different times with commodity GPS.
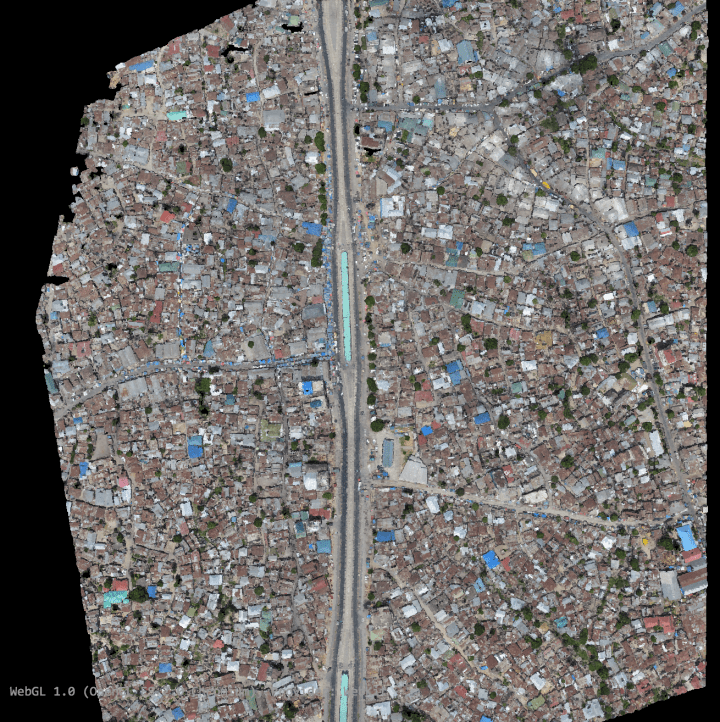
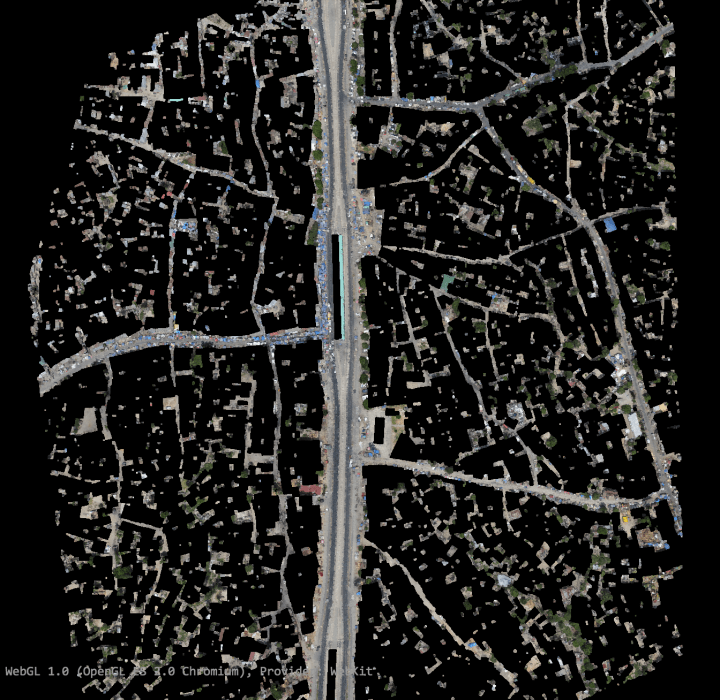
Another problem is the difficulty of turning photogrammetrically derived point clouds into Digital Terrain Models. There is proprietary software that does this well (e.g. LasTools and others), but we seek a free and open source alternative. Let’s visualize the problem. See below a photogrammetrically-derived point cloud (processed in Pix4D, visualized at https://plas.io):
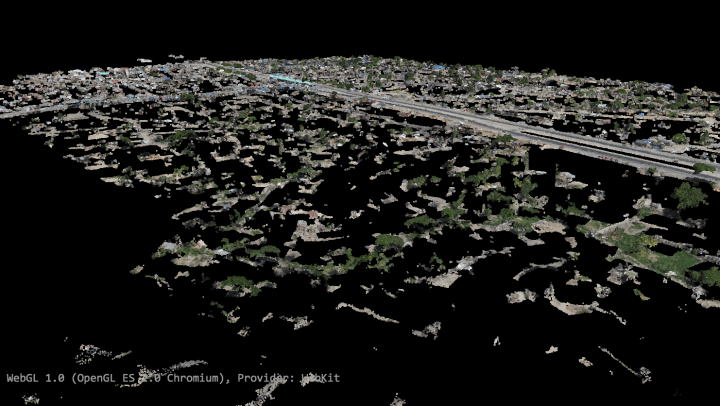
We can directly turn this into a digital surface model (DSM):
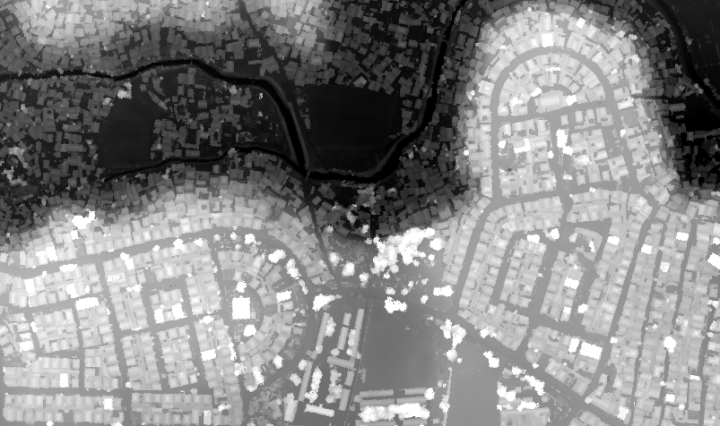
We can see the underlying topography, but buildings and trees are much of the signal in the surface model. If we, for example, calculate height above the nearest stream as a proxy for flooding, we get a noisy result.
OSM to the Rescue
If you recall at the beginning of this post, I said this is “a really fun project for me” because “most of the hard work is already done”. Dar is a city with pretty much every building digitized. We can take advantage of this work to remove buildings from our point cloud. We’ll use the utilities associated with the Point Data Abstraction Layer (PDAL) library. Specifically, we’ll use PDAL’s ability to clip point cloud data with 2D OGR compatible geometries (a great tutorial on this here).
First thing we need to do is extract the buildings from OSM into shapefiles. For this, and easy way is to use Mapzen’s Metro Extracts:
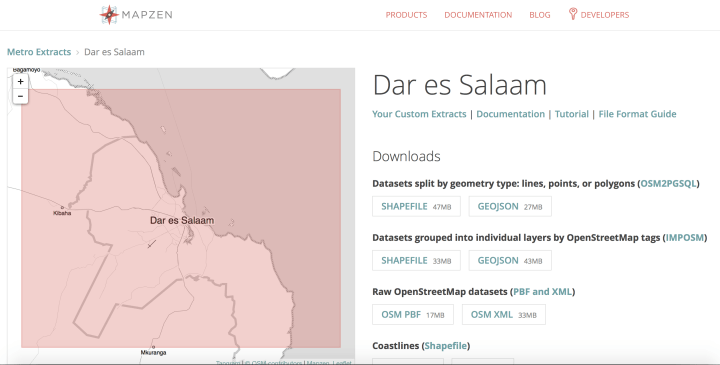
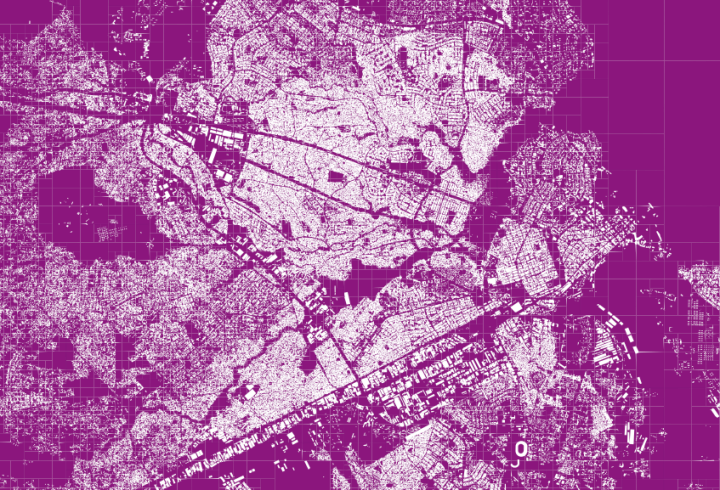
I chose Datasets grouped into individual layers by OpenStreetMap tags (IMPOSM) as this gives me the capacity to just choose “Buildings”. I loaded those buildings into a PostGIS database for the next steps. What I seek is a shapefile of all the areas which are not buildings, essentially from this:

To this:

For this we’ll need to use ST_Difference + ST_ConvexHull. ST_ConvexHull will create a shape of the extent of our data, and we’ll use ST_Difference to cookie-cutter out all the building footprints:
DROP TABLE IF EXISTS "salaam-buff-diff-split1";
CREATE TABLE "salaam-buff-diff-split1" AS
WITH subset AS (
	SELECT ST_Transform(geom, 32737) AS geom FROM "salaam-buildings" LIMIT 20000
	),
extent AS (
	SELECT ST_ConvexHull(ST_Union(geom)) AS geom FROM subset
	),
unioned AS (
	SELECT ST_Union(geom) AS geom FROM subset
	),
differenced AS (
	SELECT ST_Difference(a.geom, b.geom) AS geom FROM
	extent a, unioned b
	)
SELECT 1 AS id, geom FROM differenced;
This gives us a reasonable result. But, when we use this in PDAL, (I assume) we want a subdivided shape to ensure we don’t have to access the entire point cloud at any given time to do our clipping. We’ll add to this process ST_SubDivide, which will subdivide our shape into parts not to exceed a certain number of nodes. In this case we’ll choose 500 nodes per shape:
DROP TABLE IF EXISTS "salaam-buff-diff-split1";
CREATE TABLE "salaam-buff-diff-split1" AS
WITH subset AS (
	SELECT ST_Transform(geom, 32737) AS geom FROM "salaam-buildings" LIMIT 20000
	),
extent AS (
	SELECT ST_ConvexHull(ST_Union(geom)) AS geom FROM subset
	),
unioned AS (
	SELECT ST_Union(geom) AS geom FROM subset
	),
differenced AS (
	SELECT ST_Difference(a.geom, b.geom) AS geom FROM
	extent a, unioned b
	)
SELECT 1 AS id, ST_Subdivide(geom, 500) AS geom FROM
differenced;
Finally, if we want to be sure to remove the points from the edges of buildings (we can assume the digitized buildings won’t perfectly match our point clouds), then we should buffer our shapes:
DROP TABLE IF EXISTS "salaam-buff-diff-split1";
CREATE TABLE "salaam-buff-diff-split1" AS
WITH subset AS (
	SELECT ST_Transform(geom, 32737) AS geom FROM "salaam-buildings" LIMIT 20000
	),
buffered AS (
	SELECT ST_Buffer(geom, 2, 'join=mitre mitre_limit=5.0') AS geom FROM subset
	),
extent AS (
	SELECT ST_ConvexHull(ST_Union(geom)) AS geom FROM subset
	),
unioned AS (
	SELECT ST_Union(geom) AS geom FROM Buffered
	),
differenced AS (
	SELECT ST_Difference(a.geom, b.geom) AS geom FROM
	extent a, unioned b
	)
SELECT 1 AS id, ST_Subdivide(geom, 500) AS geom FROM
differenced;
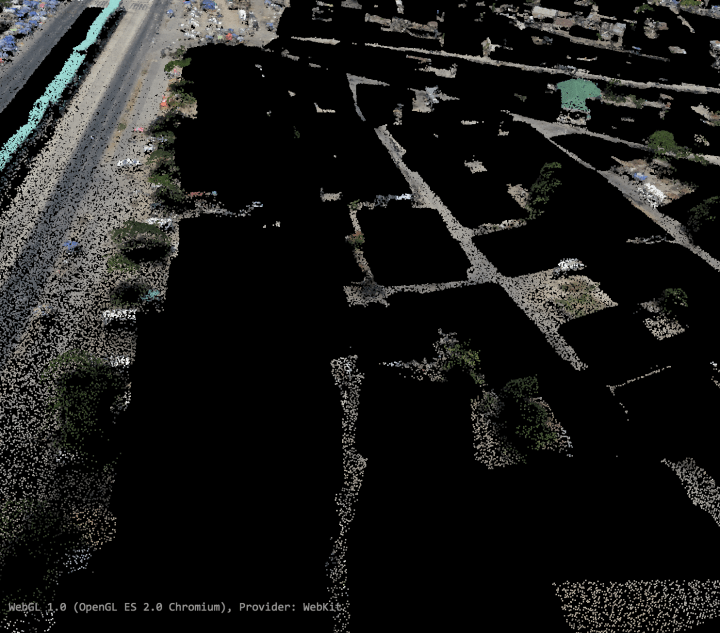
If we recall our before point cloud:
Now we have filtered out most buildings:
In order to do this filtering in PDAL, we do two things. First we create a json file that defines the filter:
{
  "pipeline":[
    "/data/2015-05-20_tandale_merged_densified_point_cloud_part_1.las",
    {
      "type":"filters.attribute",
      "dimension":"Classification",
      "datasource":"/data/salaam-buff-diff-split.shp",
      "layer":"salaam-buff-diff-split",
      "column":"id"
    },
    {
      "type":"filters.range",
      "limits":"Classification[1:1]"
    },
    "/data/2015-05-20_tandale_merged_densified_point_cloud_part_1_nobuild_buff.las"
  ]
}
Then we use these json definitions to apply the filter:
nohup sudo docker run -v /home/gisuser/docker/:/data pdal/pdal:1.3 pdal pipeline /data/shape-clip.json
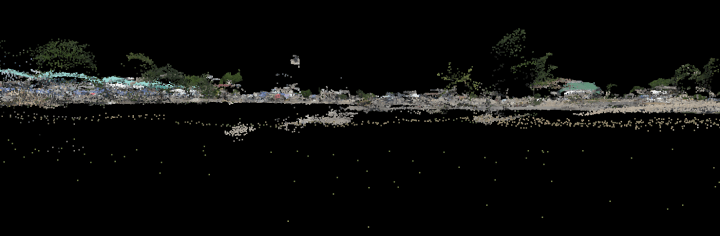
Problems continue
This looks pretty good, but as we interrogate the data, we can see the artifacts of trees and some buildings still linger in the dataset.
Enter the Progressive Morphological Filter
It is possible to use the shape of the surface model to filter out buildings and trees. To do so, we start with the assumption that the buildings and vegetation shapes distinctive from the shape of the underlying ground. We have already used the hard work of the OpenStreetMap community to filter most of the buildings, but we still have some buildings and plenty of trees. PDAL has another great tutorial for applying this filter which we’ll leverage.
Again we need a JSON file to define our filter:
{
  "pipeline": {
    "name": "Progressive Morphological Filter with Outlier Removal",
    "version": 1.0,
    "filters": [{
        "name": "StatisticalOutlierRemoval",
        "setMeanK": 8,
        "setStddevMulThresh": 3.0
      }, {
        "name": "ProgressiveMorphologicalFilter",
        "setCellSize": 1.5
    }]
  }
}
And then use that filter to remove all the morphology and statistical outliers we don’t want:
nohup sudo docker run -v /home/gisuser/docker/:/data pdal/pdal:1.3 pdal pcl -i /data/2015-05-20_tandale_merged_densified_point_cloud_part_1_nobuild_buff.las -o /data/nobuild_filtered2.las -p /data/sor-pmf.json
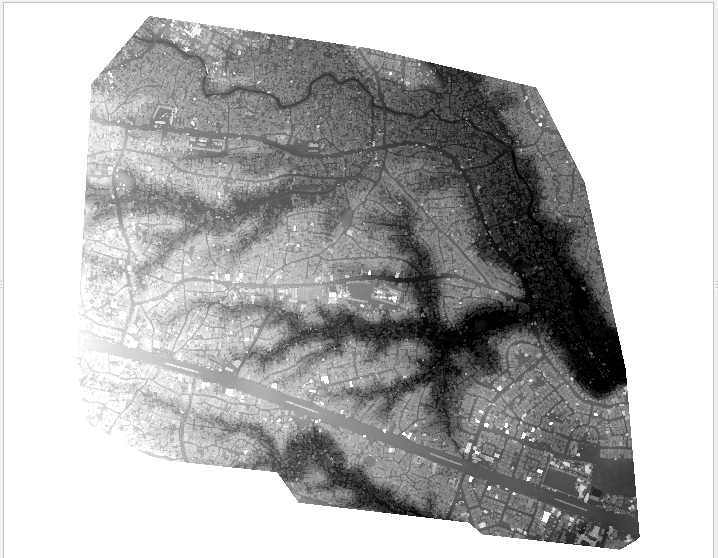
This command will remove our colorization for the points, so we’ll see the colorization according to height only:


What remains is to interpolate this into digital terrain model. That is a project for another day.

Awesome work! Would filters.range and writers.gdal in your final pipeline add the last piece – a rasterised DTM from ground-classified points?