Part 8 of N… , see e.g. my previous post on the topic.
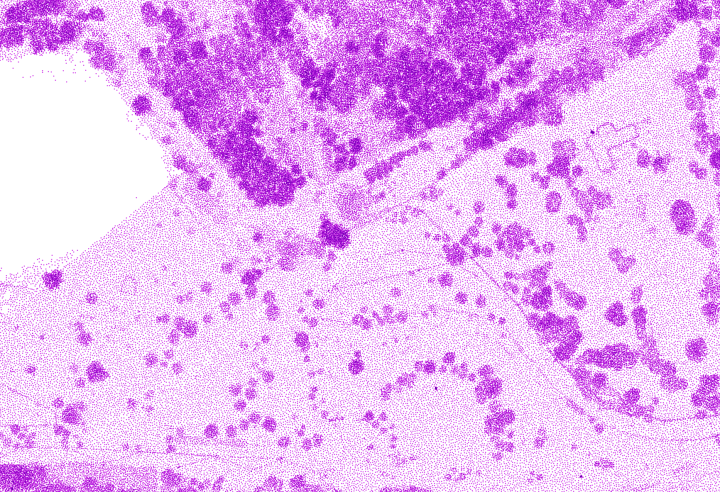
I didn’t think my explanation of sampling problems with LiDAR data in my previous post was adequate. Here are a couple more figures for clarification.
We can take this dataset over trees, water, fences, and buildings that is heavily sampled in some areas and sparsely sampled in others and use PDAL’s filters.sample (Poisson dart-throwing) to create an evenly sampled version of the dataset.

Figure showing overlap of LiDAR scanlines


{
  "pipeline":[
    "/data/20001800PAS.las",
    {
      "type":"readers.las",
      "projection":"EPSG:4269",
      "filename":"/data/20001800PAS.las"
    },
    {
      "type":"filters.reprojection",
      "out_srs":"EPSG:3734"
    },
    {
      "type":"filters.sample",
      "radius":"5"
    },
    {
      "type":"writers.las",
      "filename":"/data/poisson_8-16.bpf"
    }
  ]
}
docker run -v $(pwd)/data:/data pdal/pdal:1.4 pdal pipeline /data/pipeline.json --readers.las.filename=
/data/20001800PAS.las --writers.las.filename=/data/reproject5.las
An extra special thanks to the PDAL team for not only building such cool software, but being so responsive to questions!

One thought on “Taking Slices from LiDAR data: Part VIII”