Part 7 of N… , see e.g. my previous post on the topic.
More work on taking LiDAR slices. This time, the blog post is all about data preparation. LiDAR data, in its raw form, often has scan line effects when we look at density of points.

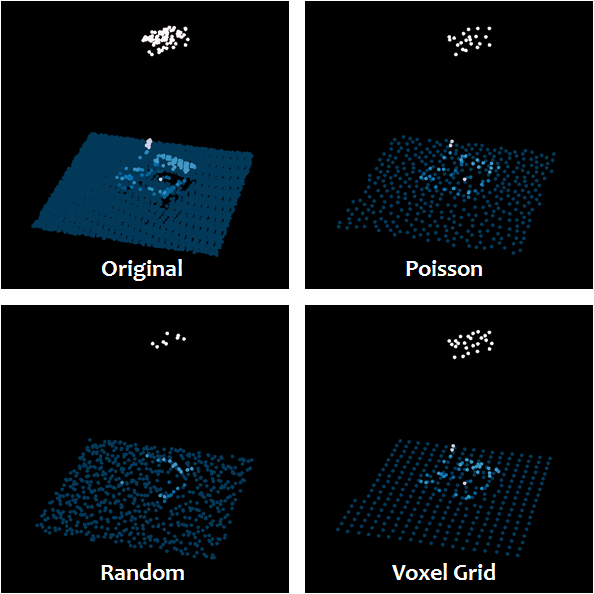
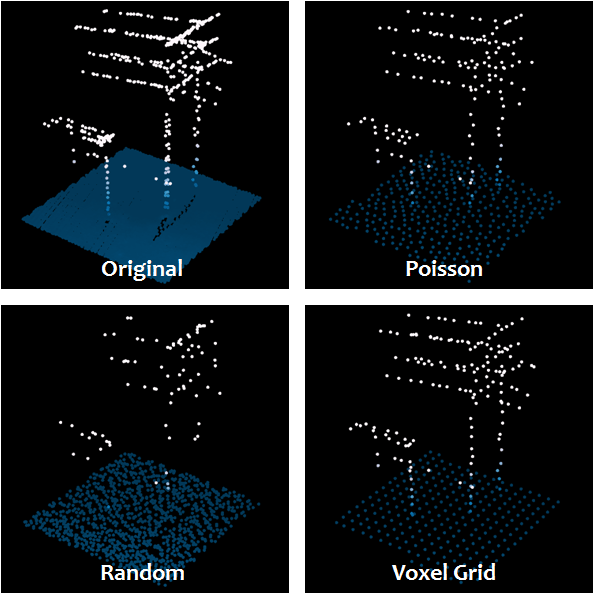
This can affect statistics we are running, as our sampling effort is not even. To ameliorate this affect a bit, we can decimate our point cloud before doing further work with it. In PDAL, we have three choices for decimation: filters.decimation, which samples every Nth point from the point cloud; filters.voxelgrid, which does volumetric pixel based resampling; and filters.sample or “Poisson sampling via ‘Dart Throwing'”.
filters.decimation won’t help us with the above problem. Voxelgrid sampling could help, but it’s very regular, so I reject this on beauty grounds alone. This leaves filters.sample.
The nice thing about both the voxelgrid and the poisson sampling is that they retain much of the shape of the point cloud while down sampling the data:
We will execute the poisson sampling in PDAL. As many things in PDAL are best done with a (json) pipeline file, we construct a pipeline file describing the filtering we want to do, and then call that from the command line:
{
  "pipeline":[
    "/data/20001800PAS.las",
    {
      "type":"readers.las",
      "projection":"EPSG:4269",
      "filename":"/data/20001800PAS.las"
    },
    {
      "type":"filters.reprojection",
      "out_srs":"EPSG:3734"
    },
    {
      "type":"filters.sample",
      "radius":"5"
    },
    {
      "type":"writers.las",
      "filename":"/data/poisson_8-16.bpf"
    }
  ]
}
docker run -v $(pwd)/data:/data pdal/pdal:1.4 pdal pipeline /data/pipeline.json --readers.las.filename=
/data/20001800PAS.las --writers.las.filename=/data/reproject5.las
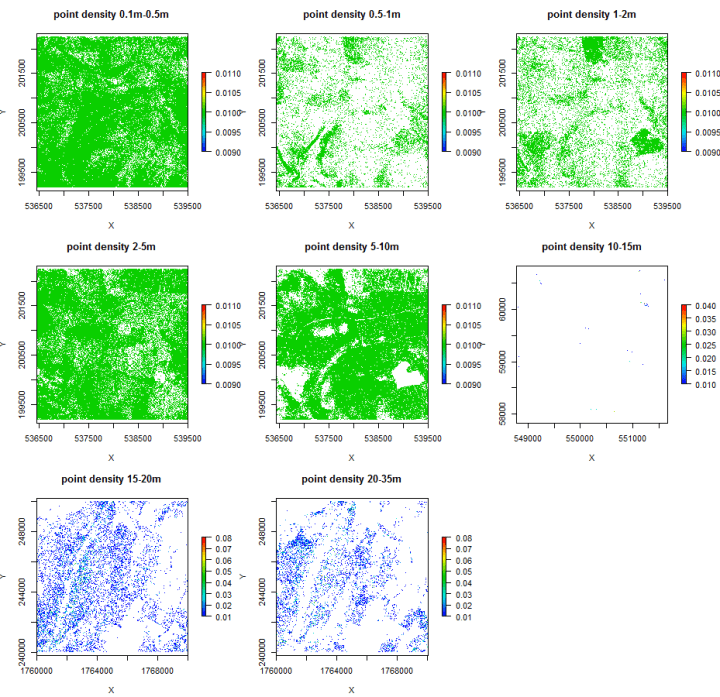
We can slice our data up similar to previous posts, and then look at the point density per slice. R-code for doing this forthcoming (thanks to Chris Tracey at Western Pennsylvania Conservancy and the LidR project), but below is a graphic as a teaser. For the record, we will probably pursue a fully PDAL solution in the end, but really interesting results in the interim:
More to come. Stay tuned.

Thank you very much for your post!
Do you know a possibility to filter by gps-time to thin out pulses instead of points?